How to create a Markov Chain Monte Carlo Model
By Matt Bass · January 01, 2022 ·TUTORIALThere has been a trend of retail investors adding their shares to the Direct Registration System (DRS). One question that has been concerning the r/superstonk subreddit is how to approximate the number of shares that have been added to DRS via ComputerShare.
This model is built on several strong assumptions and premises. The most important piece of information is from the GameStop 10Q 2021 Q3 filing, where they declared that there are currently 5.2 millions shares directly registered through October 31st, 2021. We can combine this with information being gathered by redditors to build a probabilistic model.
Computershare Accounts
Computer Share account numbers are generated using a mod11 algorithm. A mod11 algorithm is a monotonic generator that uses a tenth digit as a check digit. By taking the mod11 of a given account number we can find where it is in the sequence.
If we can find the maximum account number, we can then infer the total number of accounts that exist. Reddit user u/stopfuckingwithme has been tracking the maximum account number posted to reddit for a given day.
A post on October 30th, 2021 found that based on the current maximum account number, there were at least 72 thousand accounts in existence. We will be using this number when creating our model.
Number of Shares per Account
Members of the reddit community have been posting screenshots and letters of the shares they have added to ComputerShare. Reddit user u/Roid_Rage_Smurf created DRSBOT that collects information on the number of shares users have registered. The bot allows users to self-report the number of shares for a given post, which are then confirmed by witnesses. The number of shares is then stored in a database and displayed in summary tables in the comments.
This data set represents a small sample of accounts, from which we can infer more about the distribution.
I will be using this comment from October 31st, 2021 as my data source for this analysis.
Multiplier model
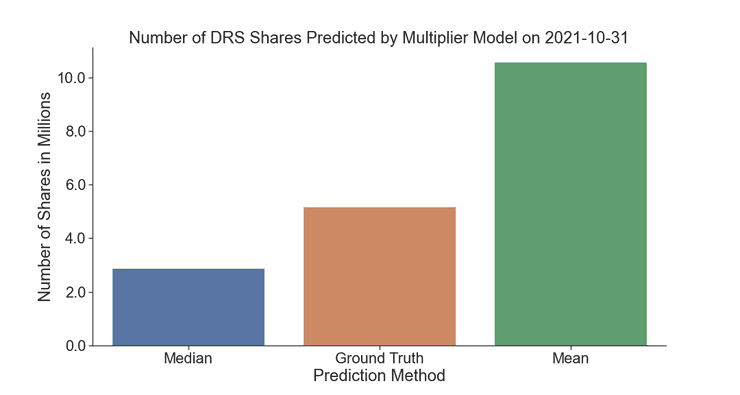
I have seen other people on r/superstonk estimate the total number of DRS shares by multiplying the number of shares by the mean or median. These methods result in over and under counting respectively.
The sample is skewed to the right by users who have many shares. The shareholder with the most shares has over 1000 times more shares than the median shareholder. Using the mean multiplied by the number of accounts to extrapolate will result in overcounting by a large margin.
Using the median has the opposite problem. When multiplying the number of accounts by the median we end up undercounting. This method doesn’t account for the users with a lot of shares and only counts users with the average amount of shares.

The method outlined here should produce a more accurate estimation because it will simulate the nuances of the particular distribution. Rather than using a multiplier model (what was described above) this model will take into account the shape of the data in order to arrive at a more accurate estimate.
Markov Chain Monte Carlo
A Markov Chain Monte Carlo (MCMC) is a method for generating a statistical prediction by simulating data with a random number generation. We encapsulate our assumptions about the data into a probability distribution, then we generate samples of data using the probability distribution. We do this simulation many times and save the results each time. Then we can combine the results of each simulation to form a probability distribution of the possible outcomes.
One really great thing about this method is that it works with limited information. I was unable to get the raw data from DRSBOT (hit me up u/Roid_Rage_Smurf) but that is OK. All we need to know is the shape of the data. And that info is being provided in the DRSBOT comments on every post.
Not only will this provide us with a prediction. It will also provide us with a range of possible values, and a probability value assigned to each. This is valuable information for knowing the confidence interval of our model.
Picking a distribution
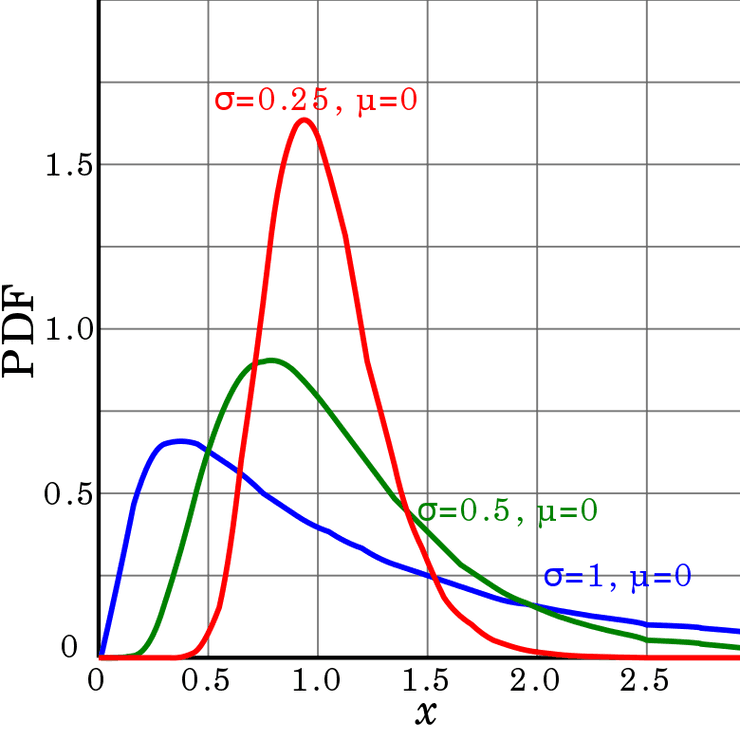
I choose a log-normal distribution as my generator. We know empirically and intuitively that the number of shares per account follows a power law. In other words it follows an exponential relationship, with the majority of the shares being held by a minority of the shareholders. This is also known as the Pareto Principle.

I wanted to represent the core distribution as a normal distribution. I suspect that the majority of shareholders fall within a narrow band in terms of the number of shares they own in DRS form. I also wanted to allow exponential values to account for whales, with a lower incidence compared to the mean. The log-normal distribution does a fair job of accomplishing both these things.
A quick note, I do not believe the data is actually normal in nature. I have simply chosen this generator because it was convenient and fit well enough.
MCMC model
First, let’s look at the distribution of the data on October 31st according to DRSBOT.
| Number of Shares | Number of People with at Least X Shares |
|---|---|
| x | 1633 |
| xx | 3290 |
| xxx | 1893 |
| xxxx | 192 |
| xxxxx | 7 |
As you can see, most people have only a few shares. We would say the distribution is left skewed with a fat tail to the right. Hopefully this convinces you that the distribution is log-normal.
Like I mentioned, small holders are being undersampled by DRSBOT. This is being corrected in the model with a higher proportion of users with 1-100 shares compared to shareholders with over 100 shares.
DRSBOT did not contain data from users with fractional shares on October 31st, while my model does represent users with less than one share.
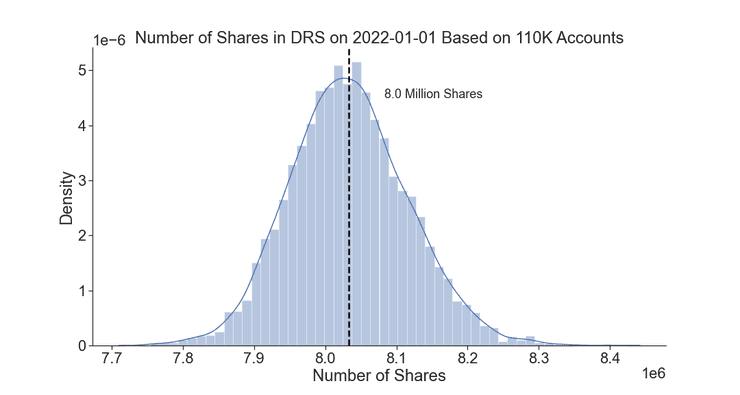
Now let’s run the simulation ten thousand times using the number of accounts on 2022-01-01 assuming there are 110 K registered shares.

According to my model the most likely estimate is 8 million shares. You can see the graph as a fat tail to the right. That is because the exponential nature of the model produced some samples with a result much higher than the mean. Because the output is normally distributed, we can assume the mean will always be the center due to the central tendency of normal distributions.
Assumptions
Our distribution is highly skewed to the right. In other words, most people have registered a small amount of shares while a few users have registered a large amount of shares. For this reason, the median is going to be a more reliable indicator of the average shareholder compared to the mean. Because the mean can be skewed by large numbers. I mean average here to be analogous to the mode, or the most common number.
In my opinion, it is safe to assume that our sample is greatly undersampling users with a small amount of shares. Assuming there were 72K shares on October 30th, 2021. DRSBOT had registered the shares from 3K accounts. That means our sample contains less than 5% of the total population. Nearly half the sample is from shareholders with over 99 shares. It also makes intuitive sense that whales would be overrepresented in our sample since whales like to flex to inspire the rest of the troops. While most people do not post to reddit or may not meet the karma requirement.
The median number of shares held on October 31st according to DRSBOT was 40. I am assuming that 95% of Computershare shareholders have less than 50 shares. So I am going to say the real median is closer to 25. I choose a standard deviation of 5 because my intuition tells me that 95% of users have between 5 to 40 shares. I also found these numbers experimentally. I played around with the parameters until the output of the model matched 5.2M when there are 72K shareholders.
P.S. I wrote the analysis using the PyMC3 library in python. I originally intended to share the notebook but I have since lost it before publishing.